Monday, July 28, 2008

Digital Ortho Quarter Quad (DOQQ)


http://www.fireimaging.com/fires/2007/california/colina/253/index.html

A Digital Ortho Quarter Quad (DOQQ) is a digital image shown as an orthographic projection. It is also a combination of the best qualities of an aerial photograph and a map. The image above is of wild fires in California.

Digital Elevation Model


http://sst.rncan.gc.ca/ercc-rrcc/theme1/t9_e.php

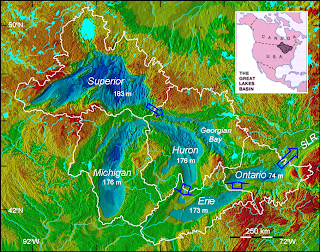
A Digital Elevation Model (DEM) is a type of topographic or terrain map. Many DEMs are shown as a grid of squares or raster. The data used to make a DEM are usually compiled using remote sensing. The DEMs are made by using regularly spaced elevation values which are tied-in horizontally either to a Universal Transverse Mercator (UTM) projection or to a geographic coordinate system. The U.S. Geological Survey (USGS) makes five main types of elevation data: 7.5-minute DEM, 30-minute DEM, 1-degree DEM, 7.5-minute Alaska DEM, and 15-minute Alaska DEM. According to the USGS they are no longer offering Digital Elevation Models as of November 2006. The DEM above is of the Great Lakes region and is a UTM projection. The purpose of this DEM is to demonstrate lower water elevations due to climate change.

DLG - Digital Line Graph

http://tahoe.usgs.gov/DLG.html
DLG is an acronym for Digital Line Graph. A DLG is a map of geographic features that is made from digital vector data to represent cartographic information. There are three different scales for digital Line Graphs, large scale, intermediate scale, and small scale. Large-scale maps are produced in 7.5- by 7.5-minute units; Intermediate in 30- by 30-minute units, and Small-scale maps are 1:2 million-scale topographic quadrangle maps. The DLG above is of Lake Tahoe; which is surrounded by several great ski destinations. Squaw Valley on the north end is my favorite.

DRG - Didital Raster Graphic

http://erg.usgs.gov/isb/pubs/factsheets/fs10602.html

DRG is an acronym for digital raster graphic; which is a scanned image of a U.S. Geological Survey (USGS) standard series topographic map. The image above is generated from raster elevation information of Juneau, Alaska. This is also a type of topographic map.

Isopleths

http://www.krisweb.com/kristenmile/krisdb/html/krisweb/maps/geomap_ten.htm

Isopleths are another form of contour line that connects areas of equal numerical value. In this example areas of equal rainfall are connected by Isopleths. So, Isopleths can be used as Isohyets which are used exclusively for rainfall; in extension, isohyets are a form of isopleths.

Isohyets

http://www.malagaweather.com/karten.htm

Isohyets are contour lines drawn on a weather map connecting points that receive equal amounts of rainfall. I chose this image to demonstrate that the rain in Spain falls mainly on the plane Portugal.

Isotachs

http://www.ssec.wisc.edu/media/April2003.html
Isotachs as pictured above are lines on a weather map or chart that connect points where winds of equal speeds have been recorded. An isotach is a type of contour line used on meteorological maps for demonstrating wind speed. This image is of part the Pacific Ocean and was produced in January 29, 2003 from a satellite orbiting Earth called GOES-10; the Isotachs are an overlay.

Tuesday, July 8, 2008

Isobars


www.netweather.tv/forum/index.php?showtopic=10660

Isobars represent areas of equal atmospheric pressure. The isobars connect equal points of pressure and the distance between isobars is the change or difference in atmospheric pressure. Lines that are close together mean stormy weather. Of the hundreds of isobar images that I could have chose I selected this one for its vibrant colors;" it dates back to the 16th October 1987. The cartoon at the top was entitled "making isobars with elastic bands."

Thursday, July 3, 2008

LIDAR


www.mlo.noaa.gov/.../gmdlidar/general_info.html
LIDAR stands for light detection and ranging. Lasers are used to measure the distance between an object and the laser source. The time delay between transmission and the collection of the reflected pulse is measured and a distance is calculated. In the photo above is of the actual laser being used, not a LIDAR image.

Doppler radar

www.bom.gov.au/.../new_radar_services.shtml

This is a Doppler image from the Bureau of Meteorology in Australia. Doppler is a radar image and another form of remote sensing. Mostly, it is a forecasting tool that is extensively used in weather prediction. Doppler was the name of the scientist that discovered this particular principle that sound waves can be deflected. In today’s usage radar sends out radio waves which are deflected off of objects in the air such as rain snow, or hail; some waves are scattered and others are sent back to the radar antenna. The information is then electronically converted into pictures showing the location and intensity of precipitation.

Black and White Aerial Photo

andrewprokos.com/.../aerial-view-black-white/

This is a beautiful black and white aerial photo of the beautiful Brookline Bridge. I have personally driven over this bridge and sailed beneath her; like a beautiful woman, she is very impressive up close. Aerial photography is a form of remote data collection of reflected energy from the sun. The reflected energy can also be classified as “passive sensors.” The use of black and white film narrows the band range of electromagnetic radiation (EMR) omitting the colors.

Infrared Aerial Photo

www.hutchville.com/tupper.shtml
Above is an infrared aerial photo of Tupper Lake in New York State. An infrared aerial photo is a form of remote sensing technology. The photo captures reflected or natural electromagnetic radiation (EMR). Infrared is a portion of the EMR that is not naturally visible and therefore a chemical must be added to the film in order to display the infrared spectrum.

Cartographic Animations

Ia Drang and Landing Zone X-Ray

Cartographic animations are a dynamic visual representation of a geographic area over time. The one that I chose for this post is a flash animated battle map of Landing Zone X-ray during one of the first battles of the Vietnam War between the 7th Air Cavalry and the People's Army of Vietnam. The battle spanned a time period of 48 hrs. To view the animation you will need to click on the URL above, and then click on the individual maps labeled LZ X-ray Map1, 2, and 3.

Tuesday, July 1, 2008

Statistical Map

www.sissa.it/he/statistical/links.html

A statistical map demonstrates how a particular variable is distributed throughout a geographic area. This map happens to be a statistical map of my ancestral country; Italy. This is a copy of an interactive map that when clicked on demonstrates statistical groups and institutions within Italy.

Cartogram

amphibiaweb.org/amphibian/cartograms/

A cartogram is another type of thematic map that distorts area for the purpose of demonstrating an attribute or feature. This map deals with amphibian diversity by Country; I chose it for its soothing shades of green.

Flow Map

www.iaspei.org/brochure/brochure.html

A Flow Map shows the direction of movement or the sequencing and ordering of information. Flow diagrams can also be used to show cause and affect relationships. Since global warming seems to be on everyone’s mind I chose the map above which shows global heat flow and was compiled from data by the International Heat Flow Commission.

Isoline Map

www.esri.com/news/arcwatch/0207/feature.html

An Isoline map is a variation of a thematic map because like a thematic map it shows data of a specific subject for a specific purpose. Information is related through the use of lines that connect points of equal value. The map above demonstrates the amount of rainfall—from 250 mm annually to 11,000 mm annually that falls on the island of Maui, Hawaii; a place that I would not mind visiting.